

Particle Concentration Measurement
Particle size analysis in milling helps determine whether processing is producing the intended particle system. A smaller average diameter may indicate progress, but it does not show whether a coarse fraction remains, whether individual components respond differently or whether the dispersion changes after processing stops.
EOS Instruments combines single particle optical classification, particle size distribution and numerical concentration through SPES technologies and the Classizer™ ONE particle analyser. For suitable materials, these measurements help connect changes in a dispersion with milling or homogenization conditions. The objective is to define a useful process endpoint and understand the material being produced.
Define what milling and homogenization should achieve
Milling can fracture solid particles, while dispersion processing may separate agglomerates without breaking their constituent particles. Homogenization can improve spatial uniformity and, in emulsions, reduce droplet size. These processes may produce similar changes in a size distribution while involving different mechanisms.
State the question before setting the measurement schedule. Is the aim to compare milling times, evaluate a dispersant, assess repeated homogenizer passes or identify differences between components? This determines which samples, controls and particle metrics will provide an interpretable answer.
Follow the full particle size distribution through the process
A particle size distribution, or PSD, shows how the detected particles are distributed across size classes. Comparing successive samples can reveal shifts in the main population, changes in distribution width and persistence of a coarse tail. A single mean value cannot describe all three.
Percentiles such as D10, D50 and D90 can support comparisons, provided the weighting basis is stated. A numerical D90 and a volume-weighted D90 describe different distributions and should not be compared as equivalent quantities. For irregular particles, the reported diameter also depends on the measurement principle and analysis model.
Inspect the complete distribution alongside selected metrics. A stable median can coexist with a changing tail, while a falling mean can conceal a second population. Establish the particle attributes that matter to the application and retain the distribution data needed to investigate an unexpected result.
What particle number adds to size reduction studies
Numerical concentration, expressed as particles/mL, adds an absolute scale to a normalised PSD. Breaking one detected particle into several can increase the count. A similar increase may occur when an agglomerate separates into smaller particles, so particle number alone cannot distinguish fracture from deagglomeration.
Concentration changes also require a consistent volume and solids basis. Dilution, evaporation, sampling losses or additions to a process can change particles/mL without demonstrating a change in comminution. Compare corrected results under documented conditions and record solids loading where it is relevant to the experiment.
The measurement window creates another limitation. Fragments below the detection limit no longer contribute to the measured count, while large feed particles may initially fall outside the upper limit. An apparent reduction in number does not therefore establish dissolution or material loss. Interpret counts with PSD, optical populations and the applicable detection interval.
Using SPES and the Classizer ONE during process development
SPES stands for Single Particle Extinction and Scattering. The Classizer ONE analyses the optical response of individual particles passing through a laser measurement region in a flowing liquid. These signals support counting and classification, with particle size and effective refractive index retrieved through appropriate models.
For milling studies, this creates an opportunity to compare more than size. A process sample can be examined for changes in particle concentration and optical response as well as its PSD. Where distinguishable components are present, selected populations can be evaluated separately instead of treating the formulation as one material.
Confirm the method’s suitability before applying it to a process series. The Classizer ONE measures particles from approximately 0.2 µm to 20 µm. The lower limit depends on the optical contrast of the particles and can be higher for weakly scattering materials. Optical contrast, particle size, liquid composition and instrument configuration affect detection. Irregular ground particles may require particular care with model selection. Effective refractive index is an analytical descriptor under the chosen assumptions. It is not a unique measurement of composition or particle shape.
Resolve components in blends with EOS Clouds
EOS Clouds represents detected particles in optical parameter space. Components with sufficiently different responses can form distinguishable regions. Classizer™ Software can retrieve concentration and PSD for selected populations, helping assess whether each component responds similarly to processing.
Consider a blend containing two particulate ingredients. The combined PSD may become narrower even if one ingredient remains relatively coarse. If the components can be separated optically, population analysis can expose that difference and guide further experiments with feed composition or operating conditions.
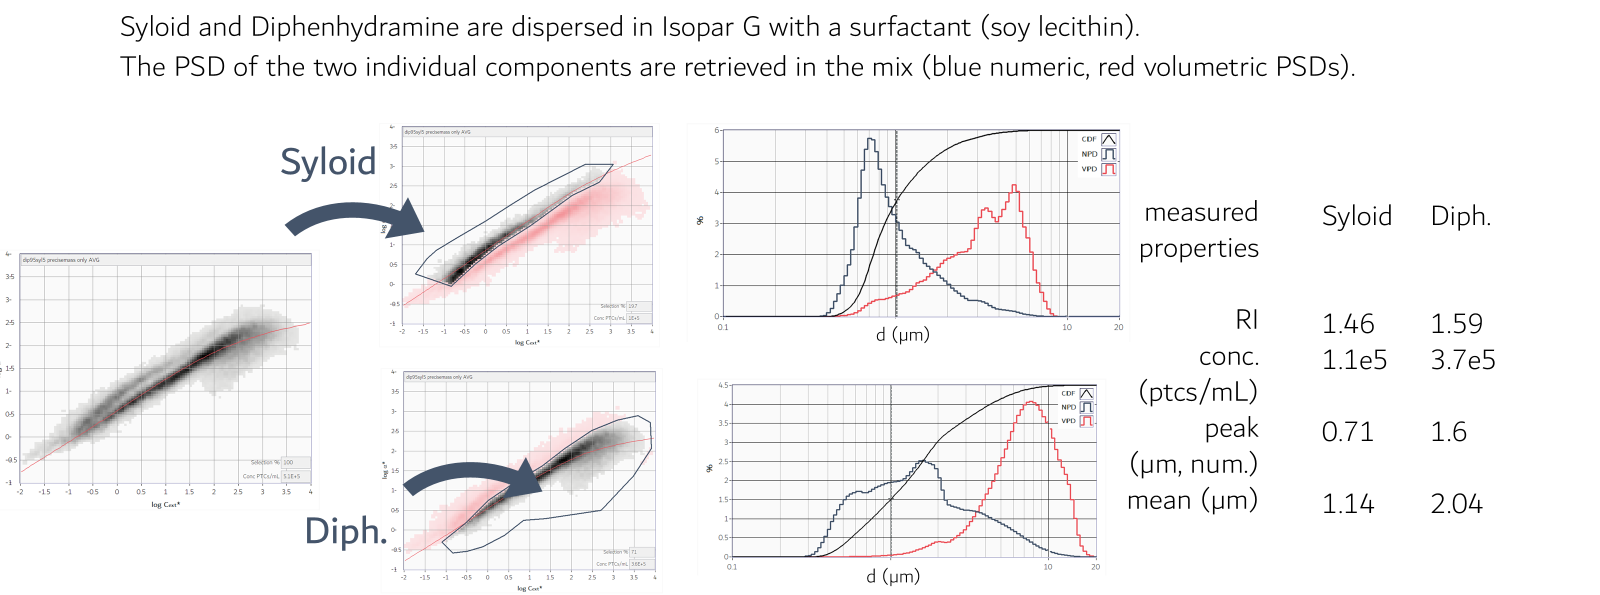
Figure 1 — Separation of the two components of a co-jet-milled blend of SYLOID® silica and diphenhydramine, dispersed in Isopar G with soy lecithin as surfactant. Each component is selected in EOS Clouds, and its particle size distribution is retrieved within the mix (blue: number-weighted, red: volume-weighted). The measured effective refractive index is 1.46 for SYLOID® and 1.59 for diphenhydramine. Source: co-micronization white paper (EOS Instruments application note AN014).
Reference measurements of the individual ingredients help support assignments. However, processing can change particle structure or association and move a population within the map. Review the whole distribution of optical events rather than assuming that a fixed selection always represents the same material. Strong overlap can limit separate quantification and require another analytical approach.
Detect a residual coarse fraction without losing it during preparation
A coarse fraction may remain relevant after the main population reaches its target size. Define the threshold and reporting basis in advance. Number fraction, volume fraction and concentration above a size boundary answer different questions. The threshold must lie within a demonstrated measurement interval for the sample.
Preparation can remove the very particles being investigated. Settling before aliquot collection, retention in tubing or selective filtration can underrepresent coarse material. Mixing and transfer procedures should preserve a representative sample while avoiding additional particle breakup during preparation.
Sufficient sampling is essential when coarse particles are rare. A short run may collect few or no events from a small population. Determine an appropriate analysed volume and precision for the intended decision. When particles outside the instrument’s range could affect performance, use a complementary method rather than infer their absence from the measured distribution.
Distinguish process improvement from temporary dispersion changes
An immediate reduction in measured size may not persist. Particles can associate again after shear is removed, and droplets can evolve after homogenization. Measure selected samples after a defined holding period as well as directly after processing when persistence matters to the product.
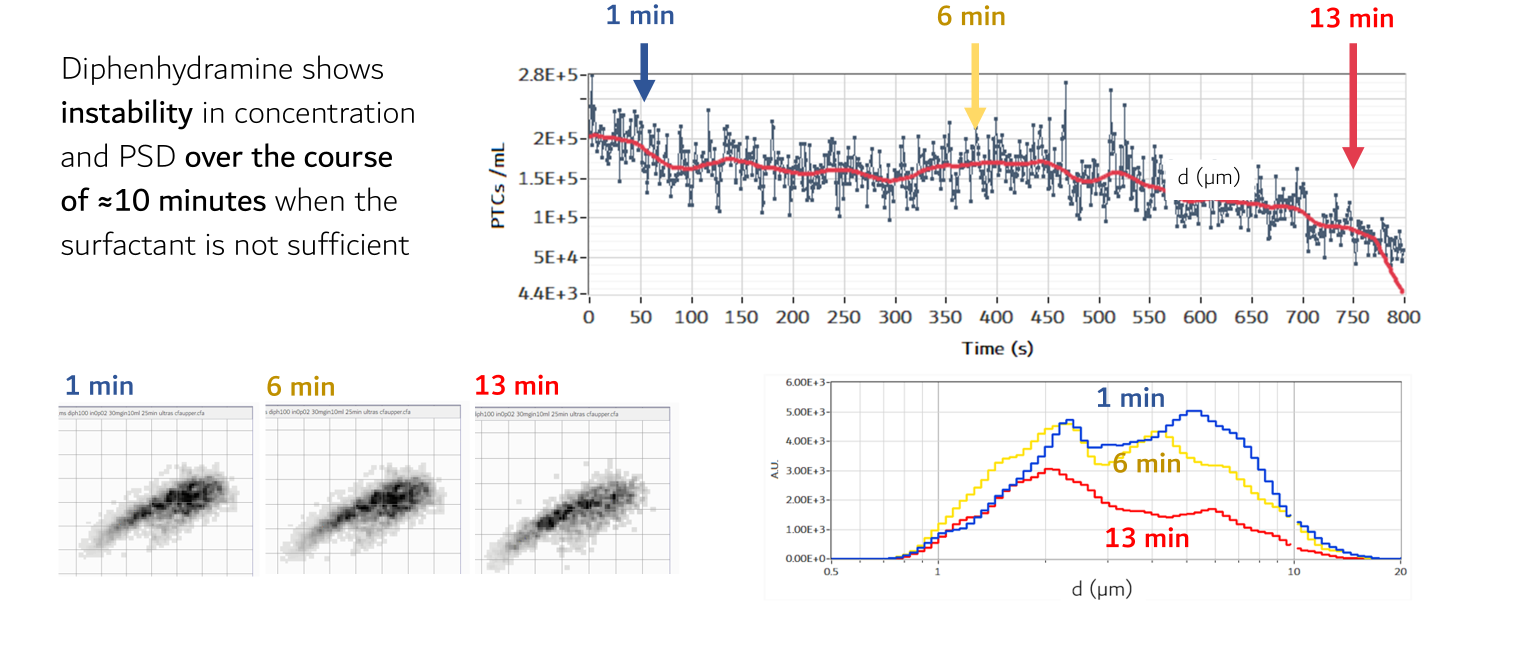
Figure 2 — Diphenhydramine dispersed with insufficient surfactant and measured continuously for about 13 minutes. The particle concentration falls and the particle size distribution changes over time, showing that the dispersion is not stable. Source: co-micronization white paper (EOS Instruments application note AN014).
A useful comparison separates process duration from sample age. If earlier samples wait longer before measurement, apparent process trends may partly reflect changes during storage. Standardise the sampling-to-measurement delay or design the study to evaluate that effect explicitly.
Particle analysis can reveal that a dispersion changed, but it cannot automatically establish why. Microscopy, rheology or application testing may help distinguish possible explanations. A stable optical population over a limited test period is supporting evidence for that condition. It does not predict shelf life in general.
Compare operating conditions using a structured process study
Select operating variables that the equipment and formulation allow you to control. These may include residence time, number of passes, rotor speed, pressure, milling media or dispersant level. Record temperature and solids loading alongside the nominal settings because they may influence both processing and the sample’s subsequent behaviour.
Change conditions through a planned comparison and retain an appropriate starting material reference. Use independent process runs where possible to distinguish a reproducible effect from variation within one run. Repeated instrument measurements are valuable, but they do not replace independent process replication.
Plot the selected particle metrics against time, passes or another relevant process variable. If an energy comparison is required, use measured or defensibly calculated energy on a stated material basis. A smaller PSD alone does not demonstrate improved energy efficiency, higher throughput or reduced operating cost.
An endpoint can combine a target PSD, an acceptable coarse fraction and a requirement for repeatability. A plateau suggests that additional processing produces little change in the selected measurements, but product performance should determine whether that plateau is acceptable. Further processing may be justified only if it improves a relevant attribute.
Plan representative sampling and process monitoring
At-line samples provide a practical starting point for comparing process stages. Collect aliquots at defined locations and times, with mixing and transfer procedures suited to the slurry or emulsion. A sample taken from a poorly mixed region may describe local segregation rather than the whole batch.
For recirculating systems, record where samples are taken relative to the processing unit and tank. Account for residence time and sampling delays when aligning particle results with operating changes. A concentration change in a sampling line can arise from settling or hold-up rather than the process itself.
The Continuous Flow Analysis (CFA) software module supports time-resolved particle analysis. Its use with process streams requires suitable flow, sampling, dilution and material compatibility. An analytical capability for continuous acquisition does not automatically establish direct installation in a pressurised, hot or abrasive production stream. The interface needs application-specific engineering.
Applications in pigments, abrasives, emulsions and mixed powders
For pigments and inks, process development may focus on coarse material, dispersion consistency and changes in individual ingredients. Particle measurements should be connected to relevant coating or printing tests. Optical classification can add information where components are distinguishable, while colour performance requires its own assessment.
Abrasive slurries and polishing pastes present a related need to understand the measured particle system. EOS Instruments application note AN013-2022 examines silica, ceria, diamond and commercial polishing formulations. It reports size distributions and optical characterisation, with interpretation of particle structure dependent on suitable assumptions. These examples establish relevant analytical applications. They do not guarantee a polishing outcome. Read the application note.
For emulsions, homogenization studies can compare droplet distributions, number concentration and changes after a defined hold. In mixed powders, the question may instead be whether each component reaches its intended distribution. Powders measured as liquid dispersions require a preparation method that preserves the features being investigated.
A co-micronization white paper published by Micromacinazione and Microsize in collaboration with EOS Instruments addresses component-level particle characterisation after joint milling. This is a concrete example of the need to examine components within a processed blend, beyond reporting only the size distribution of the blend as a whole. Explore the co-micronization study.
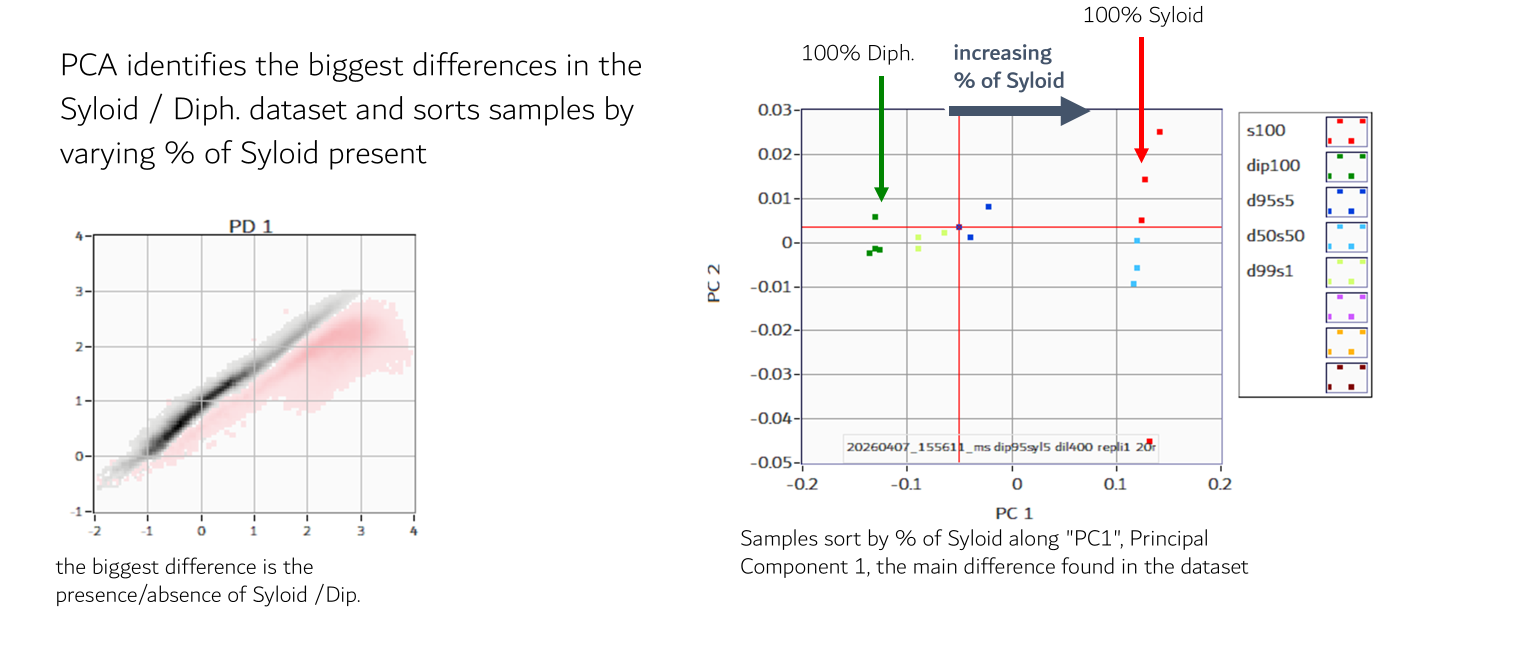
Figure 3 — Principal Component Analysis of SYLOID® and diphenhydramine blends. The samples sort along the first principal component (PC1) according to their SYLOID® content, from 100 % diphenhydramine to 100 % SYLOID®. Source: co-micronization white paper (EOS Instruments application note AN014).
Choose complementary methods for the complete process question
SPES is relevant when individual particle counting and optical population analysis contribute to the decision. Laser diffraction can provide a complementary distribution over its applicable range, while imaging can examine morphology and visible coarse particles. The methods need not report identical equivalent diameters or weighting bases.
Dynamic light scattering can support hydrodynamic size studies under suitable conditions, but heterogeneous populations and large scatterers can complicate interpretation. Sieving or other coarse-particle methods may be needed when the process question extends beyond an optical analyser’s upper range. Select methods around the expected feed and product, not only the desired final size.
Agreement should be assessed using comparable preparation, size windows and reported quantities. Different methods can reveal different aspects of the same material. Investigate discrepancies through their measurement principles before interpreting one result as confirmation or rejection of another.
Quality assurance for reproducible process comparisons
Define the analytical preparation as carefully as the production experiment. Dilution, sonication, agitation and dispersant addition can alter the sample. If preparation includes a dispersing step, establish whether it reveals the process product or continues the process on a smaller scale.
Use appropriate blanks, controls and cleaning checks. Highly concentrated slurries can create carryover risks, and dilution errors can distort concentration trends. Verify that corrected results remain comparable across suitable dilution conditions and that preparation does not selectively remove a population.
Retain acquisition conditions, analysis models, population selections and the weighting basis of reported statistics. Record sample identity, process settings and elapsed time after collection. Establish repeatability and relevant intermediate precision before treating a small difference between process conditions as meaningful.
Discuss your milling and homogenization study with EOS Instruments
Share the material, dispersion medium, starting and target size ranges, solids loading and process question with EOS Instruments. Include whether the objective involves a coarse fraction, separate blend components or time-dependent changes. A feasibility assessment can determine how the Classizer ONE, SPES and appropriate software modules can support a measurement plan alongside the required process and performance tests.
Frequently asked questions
Why measure more than average particle size during milling?
The average can conceal a residual coarse fraction, a broad distribution or different behaviour among components. Particle size distribution (PSD), concentration and optical population analysis provide additional evidence for defining a useful endpoint.
Can particle counting distinguish fracture from deagglomeration?
Not by itself. Both can increase the number of detected particles. Interpret the count together with size, optical information and complementary evidence appropriate to the material.
Does a smaller D50 demonstrate better homogenization?
It demonstrates a change in the stated distribution under the measurement conditions. Uniformity, persistence and product performance require additional evaluation. Always specify whether D50 is based on number, volume or another weighting.
Can the Classizer ONE analyse individual components after co-milling?
Selected populations can be analysed when their optical responses are sufficiently distinguishable. Reference materials and suitable models support interpretation. Overlap or changes caused by processing may limit component-specific analysis.
Can continuous analysis be connected directly to a production line?
Potentially, with a suitable interface and verified sampling, flow and compatibility conditions. The process environment and analytical requirements determine whether at-line sampling, a conditioned stream or another arrangement is appropriate.
How should the milling endpoint be selected?
Use particle attributes linked to the intended application, supported by repeatable measurements and performance testing. A process plateau is useful evidence, but it does not by itself establish that the product meets its requirements.
Related posts
