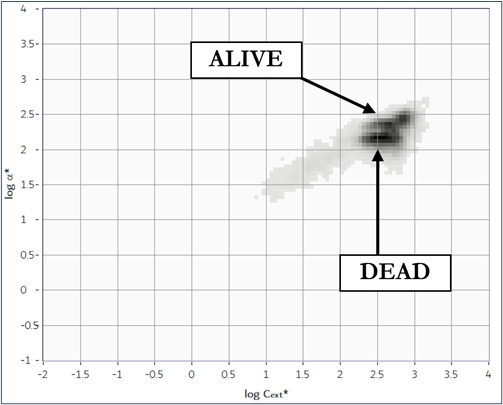
Cell viability is defined as the percentage of live cells within the total population. The determination of yeast cell viability is commonly used to assess the impact of various types of stressors in toxicity research and in industrial microbiology studies. The yeast Saccharomyces cerevisiae is a useful and widely used model organism used for studies of cyto- or genotoxicity under various chemical, physical, or environmental conditions.
Cell viability analysis is also critical in industrial applications involving microorganisms, such as food, beverage, and biofuel production. Classizer™ ONE provides an accurate estimation of the cell viability even in the presence of secondary populations and impurities.

In comparison with fluorescence kits available on the market, SPES / SPES² offer major advantages:

  • Automatic measurement of tens of thousands of cells
  • Fast measurement, requiring just a few minutes/sample
  • No need for expensive consumables
  • Minimal or even no sample preparation, except for a simple and automatable pre-dilution
  • Inline/online monitoring for industrial applications

Optical classification of a suspension of yeast cells in water

Yeast cells are slightly elliptical particles with a narrow size distribution peaking around 4 μm. When a yeast cell has an accidental or an intentional death (apoptosis), it shrinks by about 25-28% in volume, which results in an increase of its refractive index. This change in its optical properties is readily measured with the SPES/SPES² techniques.

AppCases_Cells1

EOS CLOUDS of a mixture
of alive and dead yeast cells diluted in water. Due to the lower volume, the dead cells appear in a clearly separated area of the 2D plot.

Real-time measurement of yeast cell viability

In this example of application, a sample of live yeast cell in water was diluted with increasing percentages of ethanol (0% to 50%) and monitored in real-time using the CFA (Continuos Flow Analysis) add-on of the Classizer™ ONE.
During the 20-minutes measurement, a growing fraction of yeast cells dies at a rate that is correlated with the percentage of ethanol in the sample.
The SPES/SPES² measurement allows to clearly separate the alive and dead cells and track their evolution over time.
The software makes it easy to integrate the area of the EOS CLOUDS corresponding to each population, from which the percentage of the live cells can be calculated as shown in the graph below:

AppCases_Cells2