Polymeric dispersions of particle mixes are common in a multitude of applications and products such as pharmaceutical, personal care, food, ceramics, pigments, inks, and cements. A proper dispersion of the particles is necessary to avoid sedimentation, instability, or product failure due to aggregation, oversize, and aging. Classizer™ ONE particle analyser based on patented Single Particle Extinction and Scattering (SPES) method introduces introduces a step forward in the way light scattering is exploited for single particle characterization. Classizer™ ONE provides the information on the different particulate populations in all the intermediate formulation steps and in the final product as required by bottom-up Quality-by-Design formulation, top-down Safe-by-Design approaches and product manufacturing.
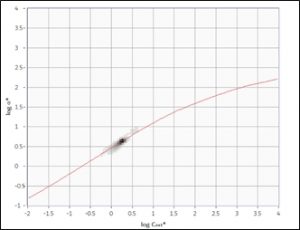
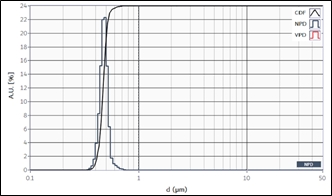
(in figure) (TOP) SPES high-resolution characterization of PS 0.5µm spheres dispersed in filtered water at a nominal numerical concentration of 1E6 ptc/mL. About 4 mL of sample have been analysed at 5ccm using a lab syringe pump. About 8000 validated particles populate the EOS CLOUDS map and are employed for the quantitative analysis. The grey tones of the cloud are proportional to relative numerical particle concentration. Location of data in EOS CLOUDS is the optical fingerprint of the sample. Red line represents expected SPES position for PS spheres with different sizes. (BOTTOM) Numerical Particle Size Distribution of the PS sample. Average particle diameter retrieved by Classizer™ ONE software is 0.48 µm @ experimentally measured n=1.58.
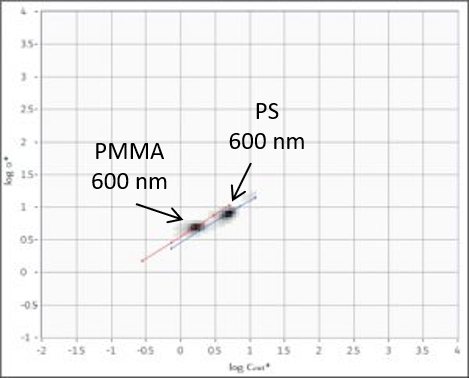
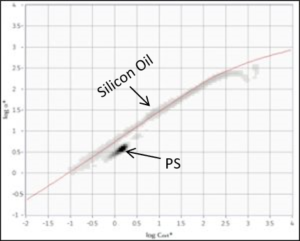
(in figure) Example of EOS CLOUDS for a heterogeneous samples: (TOP) mix of PMMA 600nm and PS 600nm submicron particles. Two separate clouds are detected and can be selected and analyzed separately, as well as for the absolute and relative concentration of each particle population. Red line and blue line are expected trends for PMMA and PS, respectively. (BOTTOM) sample of silicon oil emulsion with PS 0.5µm spheres as traceable particles. Two principal and separated populations are detected. Red line represents expected size trend for droplets of silicon oil refractive index.