

Particle Concentration Measurement
Particle quality control helps manufacturers determine whether a dispersion remains consistent with its intended properties. Average particle size is a useful starting point, but it may not reveal changes in particle number, secondary populations or optical characteristics. A batch can meet a size target while differing from the material that performed successfully in development.
EOS Instruments supports a broader comparison through the Classizer™ ONE particle analyser and SPES technologies (Single Particle Extinction and Scattering). Individual particle measurements connect size distribution, numerical concentration and optical classification. Combined with suitable reference data and statistical analysis, these measurements help laboratories investigate batch consistency and decide which differences require action.
What particle quality control needs to establish
A useful control strategy begins with a product question. Does a change in the coarse fraction affect coating uniformity? Does the number of dispersed particles influence formulation performance? Does a secondary population indicate unwanted material? The answer determines which particle attributes should be monitored and how the results will be assessed.
The analytical objective is to distinguish acceptable manufacturing variability from meaningful change. That requires more than measuring every batch in the same way. Sampling must represent the material, preparation must preserve relevant features, and acceptance criteria must be linked to the intended product or process.
Particle measurements provide evidence within this wider quality system. They do not establish chemical purity, functional performance or final product suitability on their own. Where those properties matter, particle data should be evaluated alongside appropriate chemical, physical and application tests.
Why average particle size can miss batch differences
Two distributions can have similar average diameters but different widths, tails or secondary modes. A small population of coarse particles may have little effect on a number-weighted mean while still being relevant to a particular application. A change in total particle concentration can also occur without changing a normalised size distribution.
Mixtures add another difficulty. If two components overlap in size, a combined particle size distribution, or PSD, may conceal a shift in their relative abundance. The size of the main population could remain stable while a second population becomes more numerous.
Batch analysis should therefore consider the distribution and its context. Relevant indicators may include selected percentiles, concentration within a size interval, the abundance of a secondary population and changes in optical response. The choice should follow product knowledge rather than a fixed checklist applied to every dispersion.
Combining size, concentration and optical properties with SPES
SPES examines the optical response of individual particles passing through a laser measurement region. The Classizer ONE uses these measurements for particle classification and counting, with size and effective refractive index retrieved using suitable analysis models. This provides several views of the same detected particle system.
For quality control, the value lies in connecting those views. A change in PSD can be reviewed alongside particle number concentration. A shift in an optical population can be investigated without assuming that all components in the liquid share the same material properties.
The interpretation remains sample dependent. Effective refractive index is a model-derived descriptor, not a chemical identity test. Differences in composition, structure or dispersion conditions may alter the optical response. Detection limits and model suitability should be established for the material, medium and configuration used in the control method.
EOS Clouds as a reference for batch consistency
EOS Clouds maps particles according to their optical parameters, providing a fingerprint of the detected sample. Where components are optically distinguishable, separate populations can be selected and their PSD and concentration assessed. A new batch can then be compared with the reference at both sample and population level.
This is useful when a single total or average would merge distinct behaviours. For example, the primary product population may remain consistent while a separate optical population increases. Alternatively, an entire population may move within the map, indicating a change that deserves investigation even when its count is similar.
A visual comparison is an informative first step, but routine decisions need consistent analysis rules. Keep selection boundaries, plotting conventions and preprocessing controlled. Check whether apparent cloud changes arise from sampling or measurement conditions before attributing them to the product. Overlapping populations may limit separate quantification and require complementary evidence.
Building a meaningful batch to batch reference dataset
A reference dataset should represent the variability of the process it is intended to assess. One successful batch measured repeatedly provides information about analytical repeatability, but little evidence about normal variation between production batches. Include independent batches and the operating conditions relevant to routine manufacturing.
Where appropriate, cover different raw material lots, operators, production dates and equipment states. Document how each batch was judged acceptable using established quality information. A statistical label such as acceptable should reflect a justified product assessment, rather than simply the appearance of its particle data.
Include known deviations when they can be produced and handled appropriately. These help test whether the method detects the failures of interest. Preserve independent data for evaluation, and keep replicate measurements from the same batch together when dividing datasets. Otherwise, near-duplicate measurements can make predictive performance look stronger than it is.
Using PCA for multiparametric particle analysis
Principal Component Analysis, or PCA, summarises variation across correlated variables through a smaller set of components. A score plot can show whether samples cluster together, follow a trend or differ from the reference dataset. Each point represents a sample or measurement, rather than an individual particle.
PCA is an exploratory transformation. It finds directions of variation, not automatically the directions most relevant to product failure. Scaling, normalisation, feature selection and the composition of the reference dataset can influence the result. A separation in the first two components should be interpreted with the retained variance and the underlying measurements in view.
The PCA software module supports batch comparison and supervised sample classification, including K-nearest neighbours. These are related but distinct steps: PCA represents the data, while classification assigns a new sample according to the trained approach. The model requires representative reference data before it can support routine interpretation.
A model should also allow unfamiliar samples to be investigated. A batch far from the reference groups may represent a new failure mode, a preparation problem or material outside the model’s scope. Forcing every measurement into an existing category would conceal that uncertainty.
A documented EOS Instruments example of sample classification
The PCA software module page describes a reference set containing 25 samples of 750 nm polystyrene particles and 10 similar samples containing a silicone oil impurity. The two groups form distinct clusters. Ten additional samples are then evaluated against that reference, including samples classified as not compatible with either group. Read the full EOS Instruments example.
This example demonstrates a practical route from controlled reference measurements to comparison of new samples. It does not define a universal impurity detection limit or prove that the same model will work for an unrelated formulation. The relevant concentration, matrix and process variation must be evaluated for each application.
EOS Instruments application note AN005-2022 develops the use of multiparametric SPES data for batch consistency analysis. Its broader lesson for method development is to connect optical sample differences with well-characterised reference materials and a documented interpretation procedure. Read the application note.
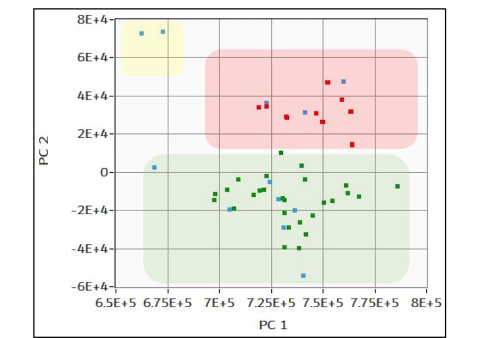
Figure 1 — PCA classification of the reference dataset and of new samples. Green: polystyrene reference samples. Red: samples containing a silicone oil impurity. Blue: new samples. The yellow region contains new samples classified as not compatible with either group. Source: EOS Instruments application note AN005-2022.
EOS Instruments application note AN014 applies PCA to co-micronised blends of two active pharmaceutical ingredients, and of an active ingredient with an excipient. Blends of diphenhydramine hydrochloride with SYLOID® silica, with acetaminophen and with hypromellose were measured with SPES. Along the first principal component, the pure components lie at opposite ends, and each blend falls between them in an order that follows its composition. The principal directions identify the differences between the EOS Clouds of the individual components. This allows the particle size distribution of each component to be characterised within the blend. Read the application note.
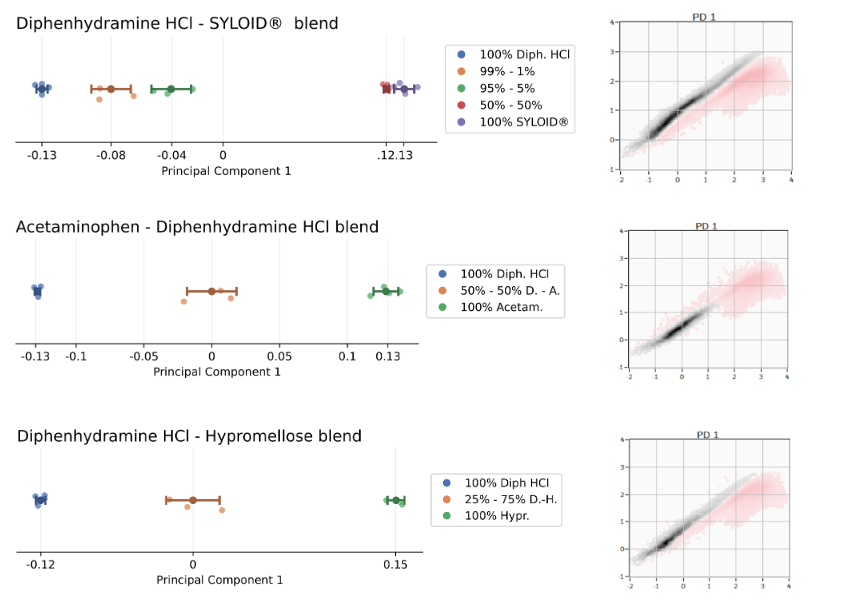
Figure 2 — Results of the PCA analysis for the blends studied, alongside their associated principal directions. Each principal direction found the differences between the EOS Clouds of the individual components in the blend. Source: EOS Instruments application note AN014.
Particle contamination and out of specification detection
Particle contamination can involve foreign material, residues from a previous product or an unwanted population formed within the formulation. SPES can support investigation when the suspect particles produce a detectable optical response and can be distinguished from the intended population. Optical difference alone does not establish the contaminant’s identity or origin.
Use blanks and process controls to help separate sample contamination from contamination introduced during preparation. Compare containers, dilution media and sampling equipment where relevant. A secondary population that appears after a preparation step deserves a different investigation from one consistently present in the original material.
An out of specification result requires a predefined specification and decision procedure. A statistical outlier is a different finding: it signals an unusual sample relative to a reference, even if individual measured attributes remain within their limits. Both can be useful, but they should not be treated as interchangeable reasons for batch rejection.
Connecting particle measurements to Quality by Design
Quality by Design links product understanding with the materials and process conditions that influence quality. Particle analysis can contribute by showing how controlled changes affect size, concentration or optical populations. Development studies can then investigate whether those changes correlate with functional performance.
For a dispersion, this might involve varying mixing conditions, raw material characteristics or a formulation parameter and measuring the resulting particle system. The purpose is to establish relationships supported by experiments. A correlation between an optical signature and performance should be challenged across the relevant operating range before it becomes a control rule.
Routine quality control can use that knowledge to select meaningful attributes and investigation thresholds. A PCA cluster is not, by itself, a proven operating region, and installing an analyser does not establish a complete Quality by Design strategy. The strength of the approach depends on the quality of the underlying product and process evidence.
Applying batch analysis across production stages
Incoming material checks can reveal differences between supplier lots before they enter a formulation. Intermediate measurements can help locate the stage at which a particle change first appears. Final product analysis then evaluates the material against its established reference and specifications.
For polymer dispersions and emulsions, a useful comparison may combine population concentration with PSD. In pigment or ink formulations, a coarse fraction or secondary population may deserve attention alongside other application tests. For abrasives, particle data can support investigation of consistency while performance testing establishes the practical importance of the difference.
These are analytical use cases, not universal acceptance criteria. Product composition, required performance and the method’s detection window determine what can be concluded. Use consistent sampling points and record the time between processing and measurement when the dispersion can continue changing after production.
Where time-resolved information is needed, the Continuous Flow Analysis (CFA) software module supports analysis of changes during a run. Integration with a process requires suitable sampling, flow conditions and sample compatibility. A result measured in a flowing stream is representative only if that stream represents the process material of interest.
Establishing a reproducible particle quality control workflow
Define sampling and preparation first. Specify mixing, aliquot collection, dilution medium, dilution factor and holding time as appropriate. Check that dilution or handling does not create aggregates, dissolve particles or alter population proportions. Preparation variability can otherwise be mistaken for manufacturing variability.
Assess measurement performance using suitable controls. Repeat measurements of one preparation help evaluate repeatability; independent preparations reveal additional variability. Where routine work spans days or operators, evaluate those effects as well. Select performance criteria that are relevant to the decision the method will support.
Keep acquisition and analysis settings consistent. Record the applicable detection interval, particle count, population selections and model version. For rare populations, sufficient counting statistics are particularly important. A run containing no detected events in a selection does not demonstrate that the corresponding material is absent from the complete batch.
Control cleaning and carryover between samples, especially when reference materials and suspected failures are measured in sequence. Review background measurements and any instrument warnings before interpreting differences. Sample automation can improve procedural consistency, but its preparation and cleaning steps still need verification for the intended materials.
Reviewing deviations and maintaining the reference model
When a new batch differs, first establish whether the measurement is valid. Review sample identity, preparation records, blanks and instrument status. Follow a defined investigation procedure for repeat measurements so that retesting does not selectively replace an inconvenient result.
Next, identify what changed in the particle data. Examine the original EOS Clouds, population concentrations and PSD alongside the statistical result. A sample-level classification should lead back to interpretable observations, such as an additional population or a broader distribution, wherever the evidence supports that explanation.
Reference datasets require controlled maintenance. Changes to suppliers, formulations, equipment or analytical settings may affect model applicability. Evaluate model updates with independent data and retain the previous version and supporting records. Gradual drift should be investigated rather than absorbed into the reference simply because it has become common.
Discuss your batch consistency requirements with EOS Instruments
Start with the quality problem: the product attribute that varies, the manufacturing stage where the change appears and the action a measurement should support. Share representative acceptable material, relevant deviations and the current analytical workflow. EOS Instruments can assess whether SPES, the Classizer ONE and the appropriate software modules can contribute to a practical particle quality control method.
Frequently asked questions
What does particle quality control measure?
It assesses selected particle attributes against a defined product or process requirement. These may include PSD, numerical concentration and optical population characteristics. The relevant measurements depend on which particle changes affect the intended application.
Can similar particle size distributions conceal a batch difference?
Yes. Concentration, population proportions or optical properties may differ even when the combined PSD looks similar. Multiparametric analysis provides additional evidence, within the method’s detection and classification limits.
Is PCA the same as a pass or fail test?
No. PCA summarises variation in a dataset. Classification and acceptance decisions require additional rules, appropriate reference data and evaluation. A separated cluster does not establish a product specification by itself.
Can SPES identify the chemistry of a contaminant?
An optical population can support detection and classification of a difference, but it does not uniquely identify chemical composition. Material assignment may require known controls or complementary chemical analysis.
How many batches are needed to train a model?
There is no universal number. The dataset must represent the intended process variation and the deviations the model needs to recognise. Independent evaluation is necessary to assess performance beyond the reference measurements.
Can batch comparison support routine release decisions?
It can contribute when the analytical method, reference dataset and decision rules have been established for that purpose. Responsibility for the release decision remains within the manufacturer’s documented quality process and applicable requirements.
Related posts
