

Particle Concentration Measurement
Particle analysis in biological fluids asks a more demanding question than particle sizing in water: can the population of interest still be distinguished and quantified after contact with a complex matrix? Proteins, droplets, cell fragments and other suspended material can contribute signals, while the particles themselves may change during incubation or preparation.
EOS Instruments uses SPES technologies and the Classizer™ ONE particle analyser to combine single-particle optical classification, particle size distribution and numerical concentration. For suitable samples, this provides a way to examine selected particle populations within heterogeneous liquids. A reliable study still depends on controls, representative preparation and a clear definition of what the measurement can establish.
Define the analytical question before choosing the workflow
Start with the particle population and the biological compartment being studied. A measurement of particles remaining in culture supernatant answers a different question from a measurement of particles recovered from a cell lysate. Neither is automatically equivalent to the administered dose or the number of particles internalised by cells.
Decide whether the objective is to compare optical properties, determine particles/mL, follow a size distribution or estimate particle recovery. These objectives may require different controls and sampling points. Record the material, nominal particle size, dispersion medium, incubation conditions and preparation history so that comparisons have a defined basis.
The target measurement should also specify its scope. A reported concentration describes detected particles within the method’s applicable window. It does not include particles below the detection limit, dissolved material or material lost before analysis. Defining these boundaries makes the result useful for experimental interpretation.
Why biological matrices complicate particle measurements
A biological fluid is both a measurement background and an environment that may alter the particles. Suspended matrix components can overlap with the target population in size or optical response. Dissolved constituents can change the properties of the surrounding liquid, affecting optical contrast and the interpretation of particle signals.
Interactions can also change the measured particles. Association with biological material, agglomeration, swelling or degradation may alter size, particle number or optical properties. Investigate each of these changes. Do not treat them as interchangeable explanations. An observed optical shift alone cannot identify the molecular mechanism responsible.
Matrix variability matters as well. Different culture conditions, fluid lots, cell states or preparation procedures can produce different backgrounds. A control prepared in simple buffer may establish the initial particle signature, but it cannot represent every interference in the final biological sample. Both types of information are needed.
What SPES and the Classizer ONE contribute
SPES stands for Single Particle Extinction and Scattering. The Classizer ONE records optical information from individual particles passing through a laser measurement region in a flowing liquid. These measurements support particle counting and multiparametric classification, with size and effective refractive index obtained using appropriate analysis models.
The practical advantage is an additional basis for distinguishing populations beyond diameter alone. If target particles and background material have sufficiently different optical responses, their signals can occupy different regions of the analysis map. Selected populations can then be examined without interpreting the entire sample as one uniform material.
This capability is conditional. Detection depends on particle properties, optical contrast, concentration, matrix and instrument configuration. A method demonstrated for one polymer in one lysate does not establish performance for every nanoparticle or biological fluid. The Classizer ONE measures particles from approximately 0.2 µm to 20 µm. The lower limit depends on the optical contrast of the particles and can be higher for weakly scattering materials, such as many particles in biological media. Confirm suitability for the intended sample, including the relevant particle sizes and matrix concentration.
Using EOS Clouds to separate target particles from background
EOS Clouds displays detected particles in optical parameter space. A reference particle dispersion helps establish the expected location and spread of the target population. Matrix controls show where background events occur. The experimental mixture can then be assessed against both references.
Classizer™ Software allows selected populations to be evaluated for numerical concentration and particle size distribution, or PSD. This is particularly useful when a combined distribution would merge target particles with unrelated particulate material. Selection boundaries should follow a documented rationale and remain consistent across comparisons where appropriate.
Biological contact may move the target population away from its original reference location. A fixed selection can then lose events even though the particles remain present. Review the complete map and possible background overlap before interpreting a reduction in selected counts. Optical similarity supports classification. It is not unique proof of chemical identity.
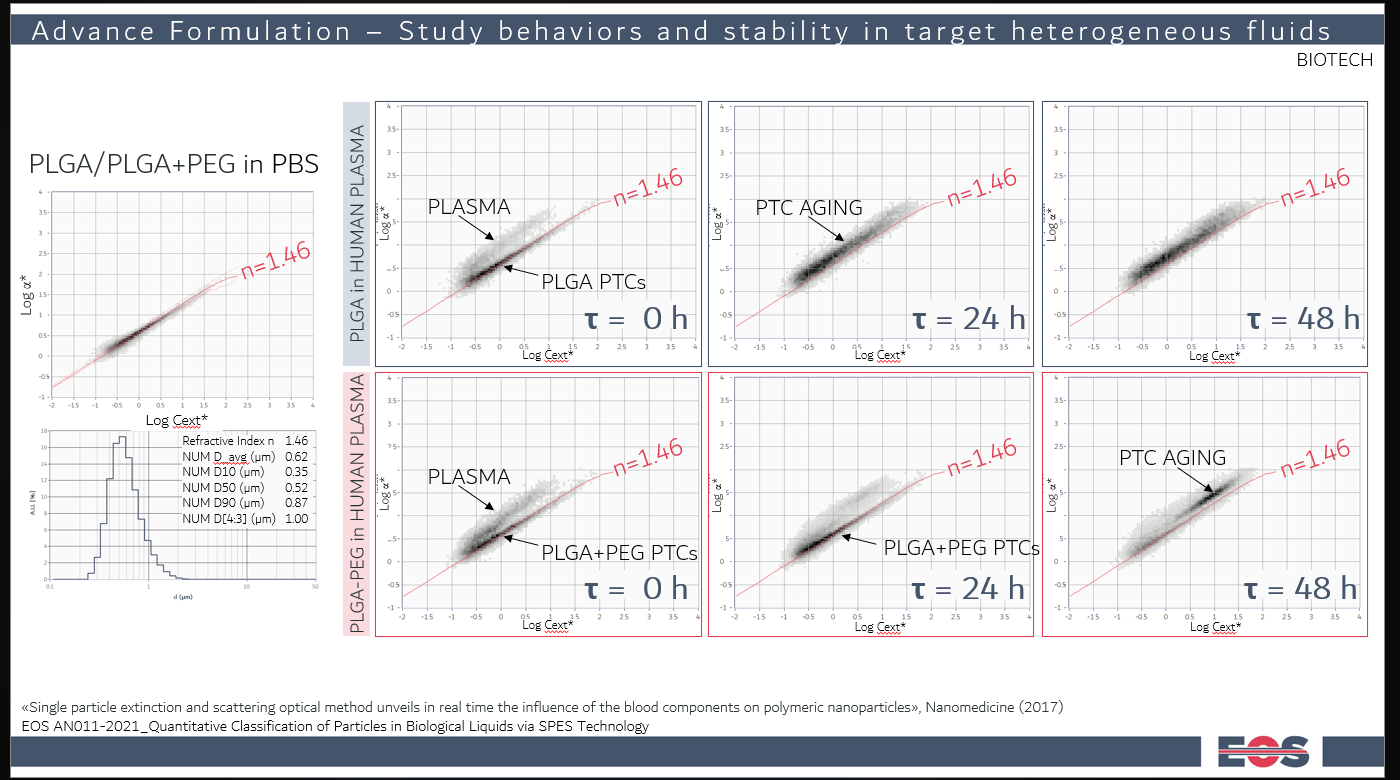
In figure, an example of how SPES can distinguish between the unwanted biological background and the particles of interested. In this case, an emulsion of PLGA particles was tracked over time to study its stability. The PLGA particles were made without (upper row) and with (lower row) surfactants to study its stabilization effect in the complex biological matric. Without surfactant, the PLGA populations degreases already at 24h, leaving no trace anymore in the EOS Cloud. With surfactant, the particles are still intact after 24h. At 48h, a population different from the blood and the original particles appears: it has bigger sizes and lower refractive index. This data was later interpreted as being possibly due to a swelling phenomenon.
Analysing particles in cell culture media and supernatants
Cell culture studies should distinguish fresh medium, incubated medium without cells, untreated culture supernatant and particle-exposed culture supernatant. These controls address different sources of background. Reagent blanks and particle-only incubations help identify changes that occur independently of the cells.
A lower concentration in the supernatant may be consistent with several processes, including sedimentation, attachment to surfaces or association with cells. It does not, by itself, quantify cellular uptake. Comparing recovered fractions and using appropriate imaging or localisation methods can help test the explanation relevant to the study.
Record the recovered supernatant volume and any dilution. A particles/mL result describes concentration, while the corresponding number in a collected fraction also depends on its volume. Changes in medium volume, sampling or evaporation can otherwise complicate comparisons between experimental conditions.
Working with cell lysates and recovered fractions
Lysis converts a structured biological sample into a heterogeneous suspension. Cell fragments, membrane material and preparation reagents can contribute background or modify the particles. A lysate from untreated cells, prepared by the same procedure, is therefore a central control in this workflow.
Evaluate whether the lysis method preserves the analytical target. Surfactants, mechanical disruption or other treatments may alter a coating, disperse clusters or change the observed population. A particle added after lysis tests a different part of the workflow from a particle added before preparation. Comparing these controls helps locate losses or changes.
For cell-associated measurements, document the washing procedure and examine relevant wash fractions when needed. Surface-associated particles can remain with a cell pellet, and released particles can enter later fractions. A lysate count becomes evidence about internalisation only when the experimental design can distinguish internal from external association.
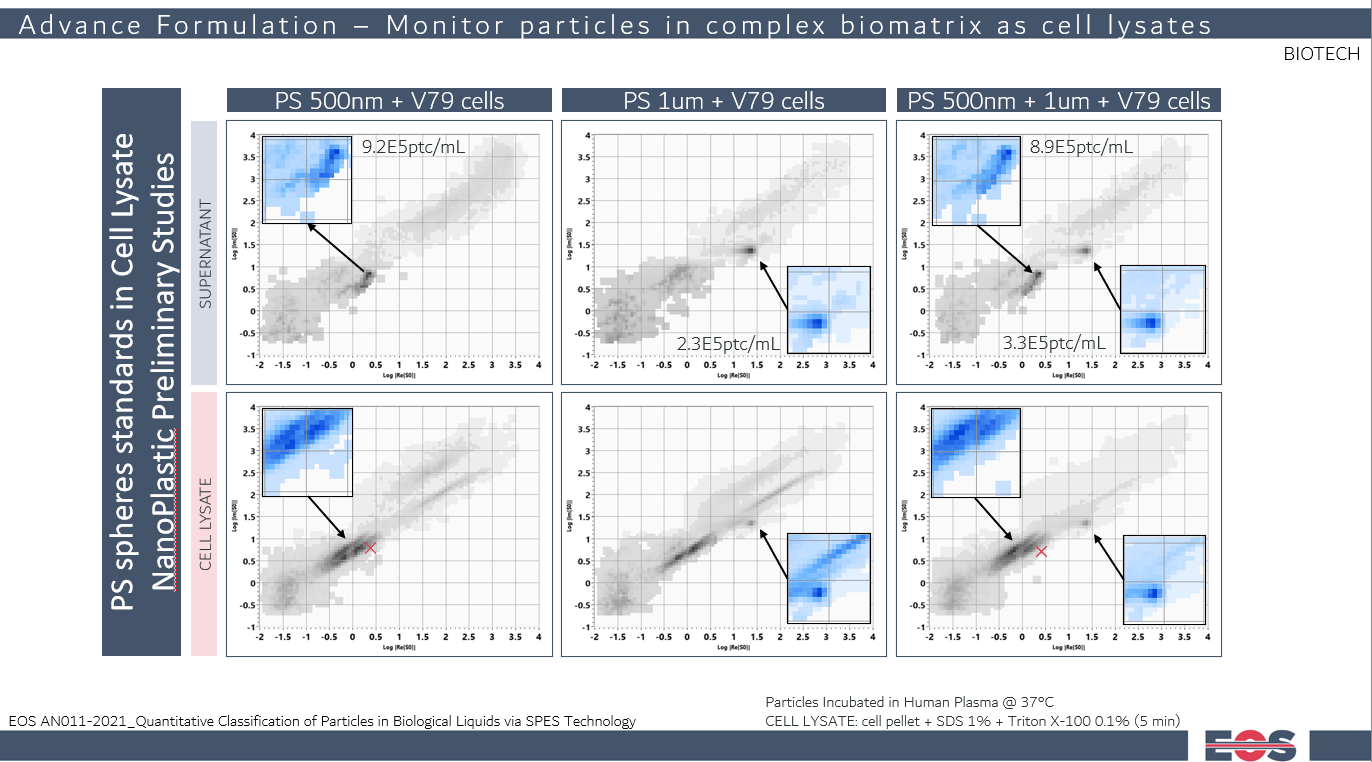
In figure, cell lysates with PS spheres was measured with SPES, after incubation in human plasma. The particles were found both in the supernatant and in the cell lysate. Despite all the organic debris, SPES is capable of isolating the PS particles from the background signal.
Documented EOS Instruments studies in biological liquids
EOS Instruments application note AN011-2021 reports two research examples: poly(lactic-co-glycolic acid) (PLGA) particle formulations incubated in a human biological fluid, and polystyrene reference particles examined in V79 hamster lung fibroblast cell culture supernatants and lysates. The studies use optical population analysis to investigate particles within heterogeneous backgrounds. Read the application note.
In the PLGA example, formulations with and without polyethylene glycol (PEG) stabilisation were compared over time. Optical changes differed between the formulations. In the cell study, 0.5 µm and 1.0 µm polystyrene particles were investigated separately and as a mixture. The smaller particles showed an optical change in the lysate relative to their reference position.
These examples demonstrate sample-specific feasibility. They also expose a practical limitation. Background overlap can complicate interpretation and require careful evaluation of the matrix contribution. The published work provides experimental context for developing a method; it does not establish universal recovery, chemical identification or performance in all biological matrices.
Measuring particle recovery without confusing concentration and yield
Particle recovery compares the amount detected after a workflow with a defined reference amount. For number-based measurements, first calculate the particle number in each relevant fraction from its concentration, collected volume and applicable dilution correction. Compare quantities on the same basis rather than comparing particles/mL values alone.
A practical spike recovery study compares a matrix containing a known addition with an equivalent unspiked matrix. The recovered increment is assessed against the added particle number. This assumes that background treatment is appropriate and that the spike remains detectable and classifiable. Establish acceptance criteria for the particular method and intended interpretation.
Recovery is not necessarily a conserved primary particle balance. An aggregate counted as one particle may contain many primary particles, while fragmentation can increase the number of particles. Dissolution or movement outside the detection window can decrease the reported count. Interpret recovery alongside PSD, optical population changes and the preparation controls.
Background subtraction also requires care. The matrix contribution in a mixed sample may differ from that in an untreated control if interactions occur. Subtracting a control distribution can therefore introduce bias. State the assumptions and assess uncertainty before using a corrected concentration as a quantitative endpoint.
Designing incubation studies that preserve interpretable comparisons
Choose time points and controls around the expected analytical change. Measure the initial particle dispersion and the relevant matrix backgrounds, then compare matched preparations at each time point. Record incubation temperature, mixing, storage and the delay between sampling and analysis.
Dilution is especially important in biological work. It can change ionic strength, protein concentration and the balance between associated and free material. A diluted sample may remain informative. It represents a defined preparation made after incubation, and it no longer shows the original fluid untouched. Evaluate dilution conditions and timing for their effect on the target population.
Where possible, use independent preparations and biological replicates as well as repeated instrument measurements. These address different sources of variability. Repeated analysis of one tube can establish measurement repeatability, but it does not describe variability between cultures, fluid lots or incubation experiments.
Comparing methods for complex biological samples
Select complementary methods according to the question each can answer. SPES provides individual particle optical information and population analysis where detection and separation are suitable. It can help connect count, PSD and optical changes within a mixed sample.
Dynamic light scattering provides hydrodynamic size information from fluctuations in scattered light. A broad or heterogeneous biological background can complicate attribution to the added particles. Nanoparticle tracking analysis follows visible individual particles and can estimate size and concentration, with performance dependent on visibility, settings and sample conditions. Neither method should be dismissed categorically. Suitability must be demonstrated for the actual matrix.
Microscopy can provide morphological or localisation evidence, while fluorescence-based approaches can help track labelled material. Labels and preparation can introduce their own controls and interpretation requirements. Chemical analysis may be needed to establish material identity or quantify a dissolved fraction that optical particle counting does not measure.
Results from different methods need not use the same size definition or count the same particles. Compare measurement windows, preparation and reported quantities before interpreting disagreement as an instrument failure. A combined workflow is strongest when each method addresses a specific uncertainty.
Quality assurance and reporting for biological particle analysis
Establish a control set that covers the analytical pathway: dispersion medium, biological matrix, preparation reagents, target particles and the relevant experimental combinations. Check carryover between samples, particularly when concentrated references are followed by low-level biological fractions. Retain acquisition warnings and background observations with the study records.
Assess precision and the ability to detect the intended change using representative samples. Adequate event counts are important for small selected populations. Low counts may require additional measurement volume or a revised method, provided the sample remains stable. A selection containing no events is not evidence that the corresponding material is absent from the original biological system.
Report the detected size interval, dilution, analysed fraction, population selection, model and concentration units. Describe recovery calculations and any background correction. When reporting effective refractive index or size changes, retain the assumptions used to derive them and distinguish measured optical differences from the proposed biological explanation.
Plan your biological particle study with EOS Instruments
Share the particle material, expected size, biological matrix and experimental objective with EOS Instruments. Include the available controls, likely concentration and any preparation steps that could change the sample. A feasibility assessment, with measurements on biological samples carried out in your laboratory, can establish whether the Classizer ONE and SPES provide suitable detection and population separation, and which complementary measurements would make the conclusions stronger.
Frequently asked questions
Can particles be analysed without removing the biological background?
For suitable samples, SPES can distinguish target populations within heterogeneous fluids without preparative filtration or purification. Dilution or other handling may still be necessary. Matrix compatibility and population separation must be evaluated experimentally.
Does a cloud in EOS Clouds identify a particle chemically?
No. It represents an optical population. Reference materials and matrix controls support assignment, but overlapping responses or changes after incubation may require complementary evidence of identity.
Can a lysate measurement prove cellular uptake?
A lysate count alone cannot establish where particles were located before lysis. Washing controls, recovered fractions and appropriate localisation methods are needed to distinguish internalised particles from particles associated with the cell surface.
Can optical changes demonstrate a protein corona?
They can indicate a change in the particle system, but they do not establish a protein corona or identify its composition by themselves. A specific molecular interpretation requires supporting experiments.
Why measure both particle size distribution (PSD) and particles per millilitre?
PSD describes the size distribution, while particles/mL provides its numerical concentration scale. Together they help distinguish changes in detected particle number from shifts in size, subject to the method’s measurement window.
Will a method validated in buffer work in a biological fluid?
Not automatically. Background, optical contrast and particle behaviour can differ. Evaluate the intended matrix and preparation procedure with appropriate controls before drawing quantitative conclusions.
Related posts
