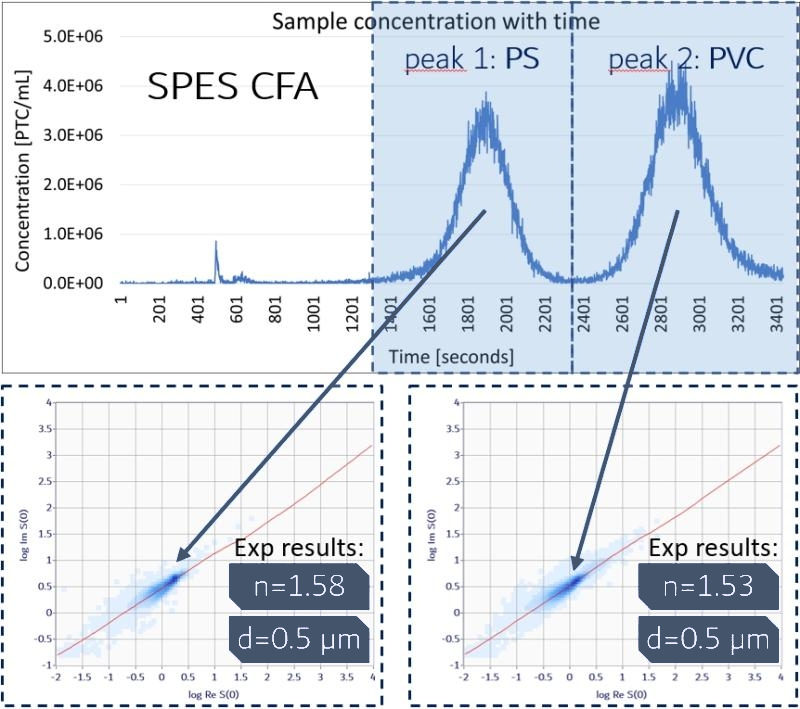
(in figure) SPES data; in-line detection and analysis of a mix of subvisible PS and PVA microplastics; flow 1ccm; coupled with a commercial Flow Field Fractionation separator and an in-line UV-Vis detector)
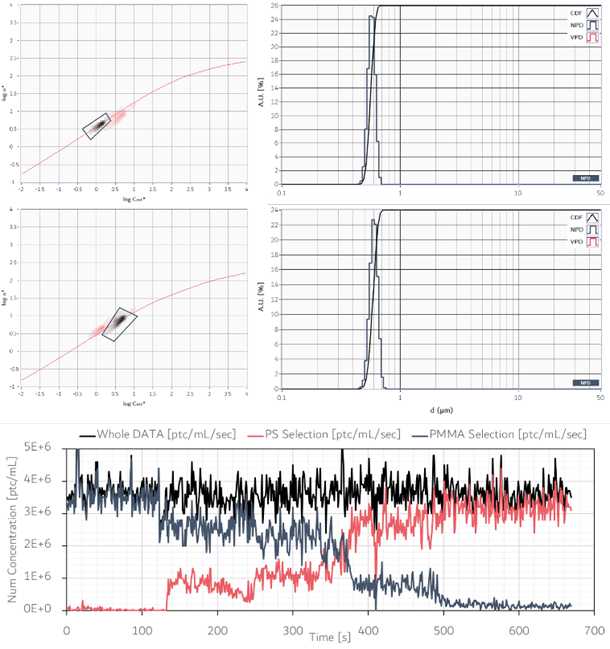
(in figure) EOS CLOUDS histogram corresponding to a CFA run of a constant flow with a time-varying mix of two kind of particles. Two clouds are detected with different optical properties. (top left) selection of EOS CLOUDS corresponding to the first particle population detected; (top right) particle size distribution from the corresponding selection. Size and RI values are in good agreement with values expected for 600nm PMMA particles; (middle left) selection of EOS CLOUDS corresponding to the second particle population detected; (middle right) particle size distribution from the corresponding selection. Size and RI values are in good agreement with expected ones (600nm PS particles); (bottom) time evolution of the numerical particle concentrations for the whole sample (black), for the particle population in the top selection (PMMA, red) and middle selection (PS, gray blue).
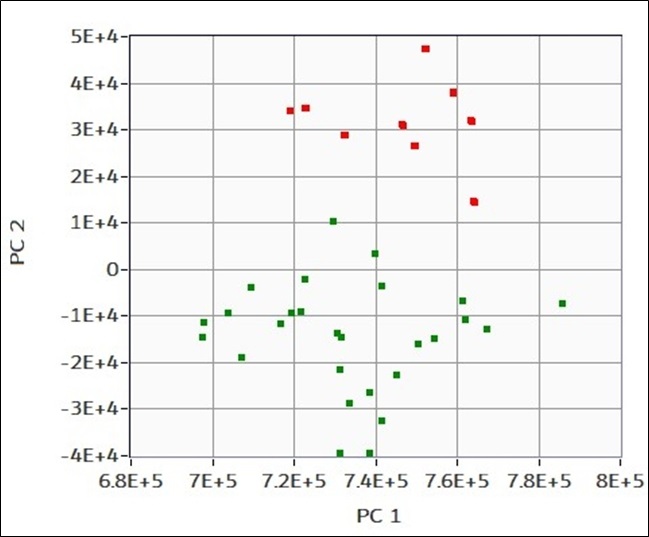
(in figure) A training set of twenty-five samples of 750nm polystyrene particles are prepared, measured, and labeled “good”. Ten samples of the same kind plus a small impurity of silicon oil are prepared, measured, and labeled as “bad”. PCA is performed to evaluate the capability of discriminate the two cases even if the differences are small in terms of EOS CLOUDS and particle size distribution. Graphical representation of the fist principal component PC1 to second principal component PC2 for each measure. The eigenvalues, and thus point locations, are automatically calculated by the EOS PCA algorithm without relying on information provided by the user. The labels inputted are used to color the points and help the user in the data interpretation. In this case two separate clouds of data results, red one corresponding to “good” sample and green corresponding to “bad” samples. Separations on the horizontal axis (PC1) which corresponds to the numerical concentration and on the vertical axis (PC2) correspond to optical differences between the measures.
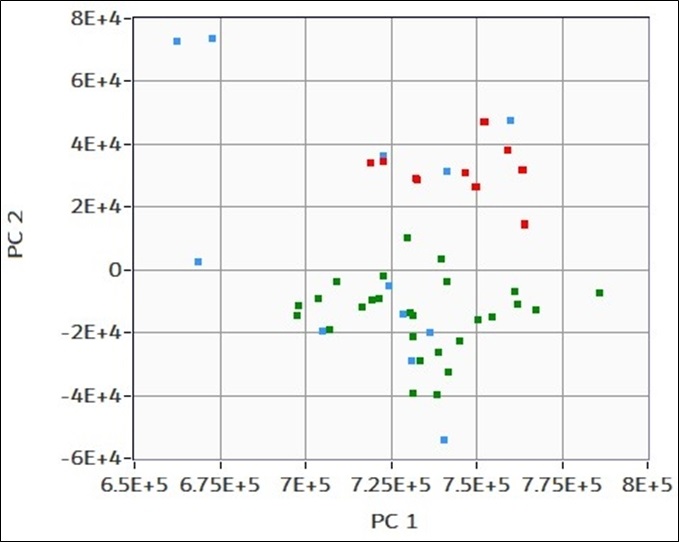
(in figure) A batch of ten novel unknown measures are loaded and compared to the same directions PDs of the previous training set. PCs of the novel samples (blue) are thus compared to the PCs of the reference dataset (red/green). It can be observed that five measures fall in the “good” green area, one falls in the “bad” red area, while the remaining four are far from both. K-nn algorithm is used to define affinity and classifeach novel sample as one of the two populations in the training dataset. The software thus retrieves a list of “good”/”bad”/NA labels for each novel measure. NaN correspond to data non compatible with “good” or “bad” population for the K value used.